$VIX Down 47%, S&P Up 400 Points - Historical Trends are Holding


There are only 4 days left in March.
Which means there’s only one month left before we have to “sell in May and go away.”
That’s why I’m focusing so heavily on historic, seasonal trends.
Remember, the S&P has posted a positive return in April 92% of the time.
So we should be looking to make as much profit as possible over the next month.
It looks like the market will follow these seasonal trends.
And I’m showing Stock Navigators how to position their portfolios on the profitable side of historic price patterns.
Macro Trend Breakdown
All Major Indices are Moving Up
The S&P, the Nasdaq, and the Dow are all rallying higher in unison.
If this upward trend continues, we may see yet another profitable April this year.
And I’m looking forward to a bullish spring.
Here’s what the S&P looks like right now…
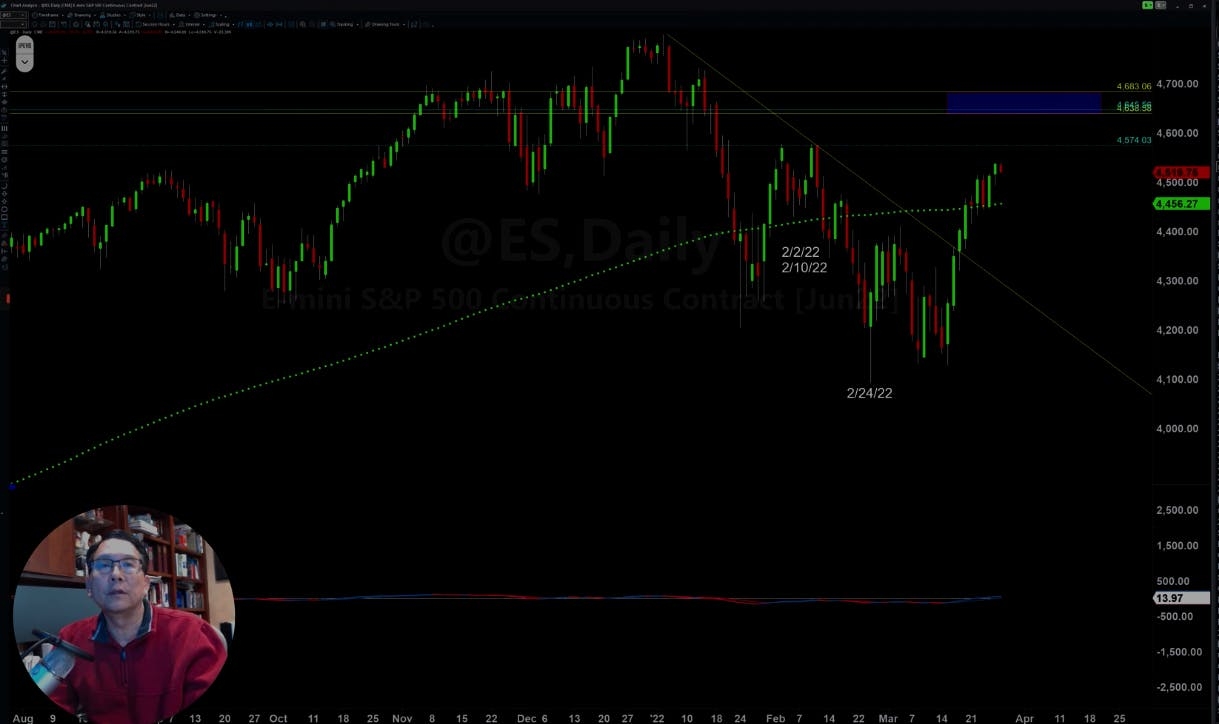
We’ve hit a double bottom and now it’s trading above its 200-day moving average of $4,456.27.
The Nasdaq is showing a similar pattern to the S&P…
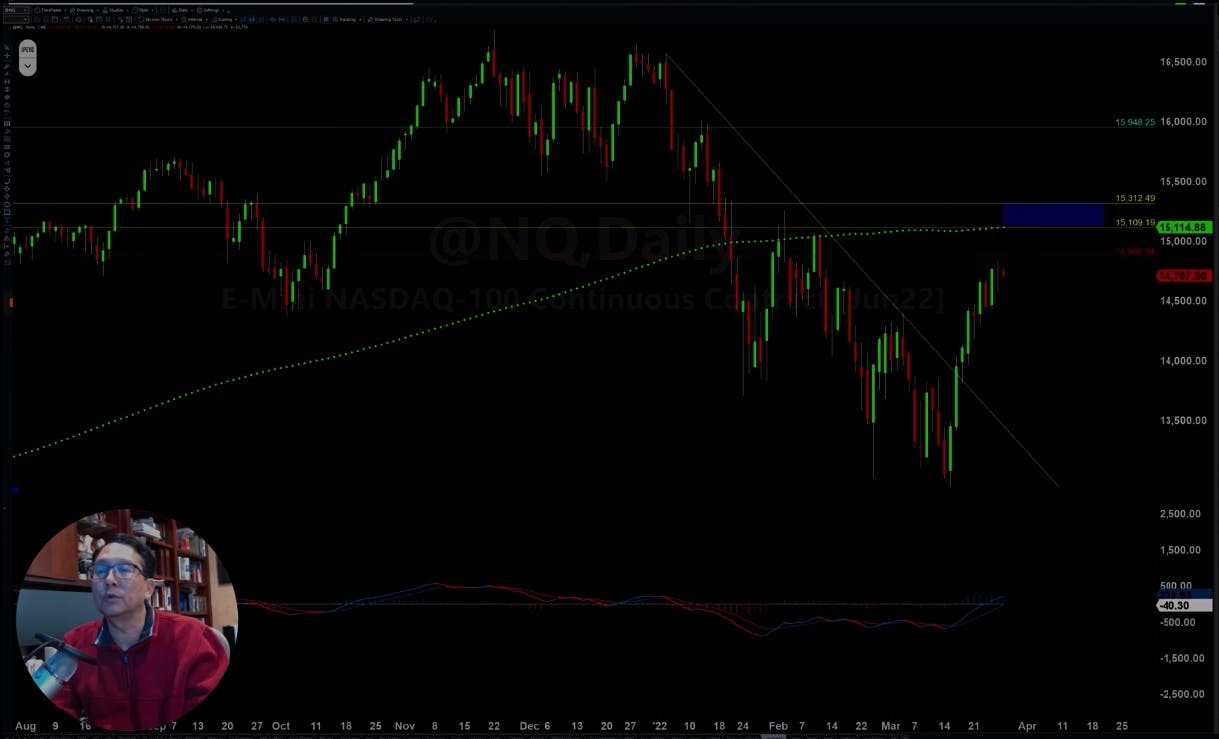
Although it’s still trading below its 200-day MA, we’re seeing very bullish activity.
Same thing with the Dow…
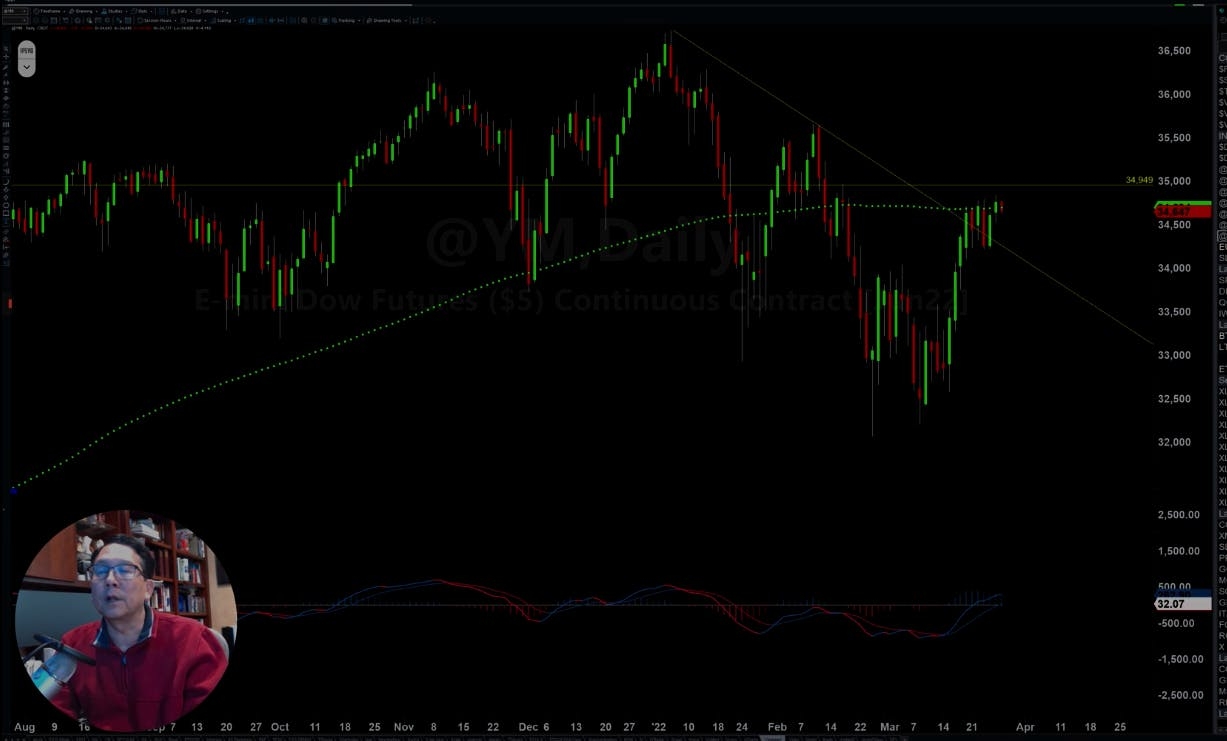
It’s found support at the $1,900 level and is currently moving up.
However, these charts tell me that we need to see even more upward momentum before we can confidently call this a bull rally.
Not only do I notify Stock Navigators when the market rises, I show them what to do to profit from bullish price action - click here to get all of my stock updates.
Sector Highlight
Oil and Gold Look Jumpy
When Russia first invaded Ukraine, oil and gold both rallied higher together.
Now, they’re starting to break away from each other.
Let’s take a look at the chart for crude oil...
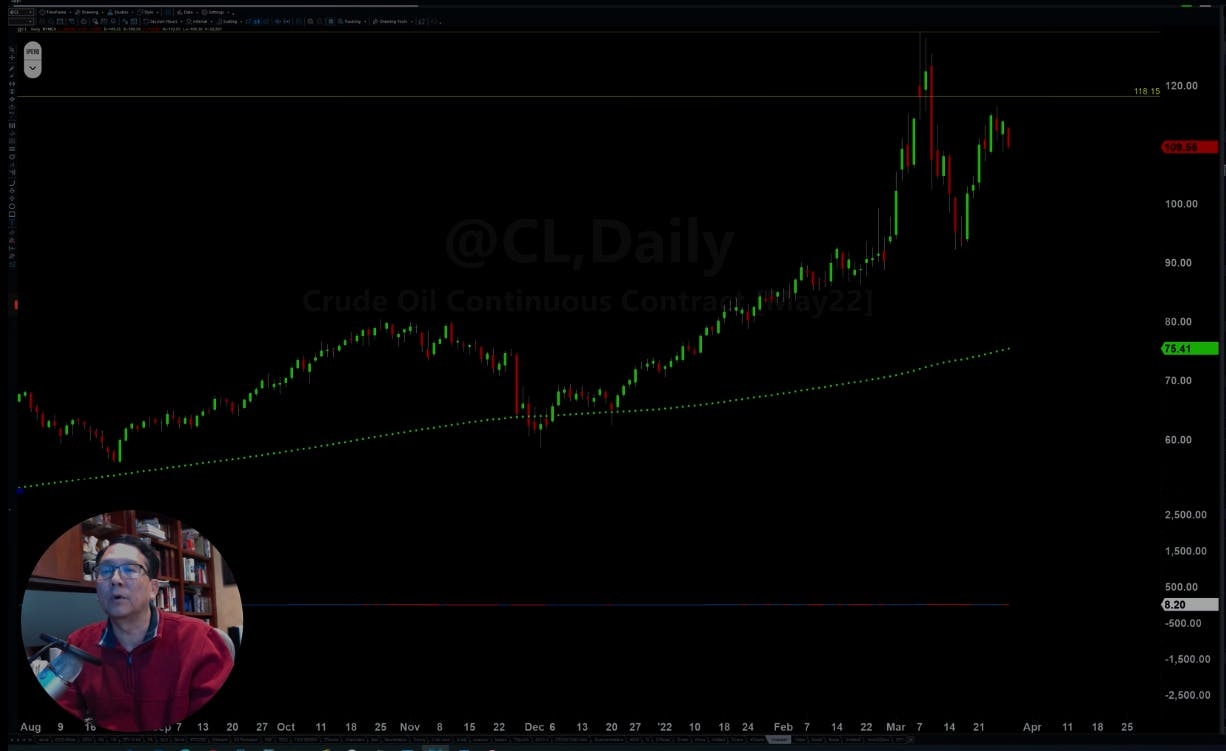
It currently has resistance at the $120 level and support at the $95 level.
Although we see big, red candles… this is still bullish activity.
However, it’s also very volatile activity.
Gold is showing similar behavior…
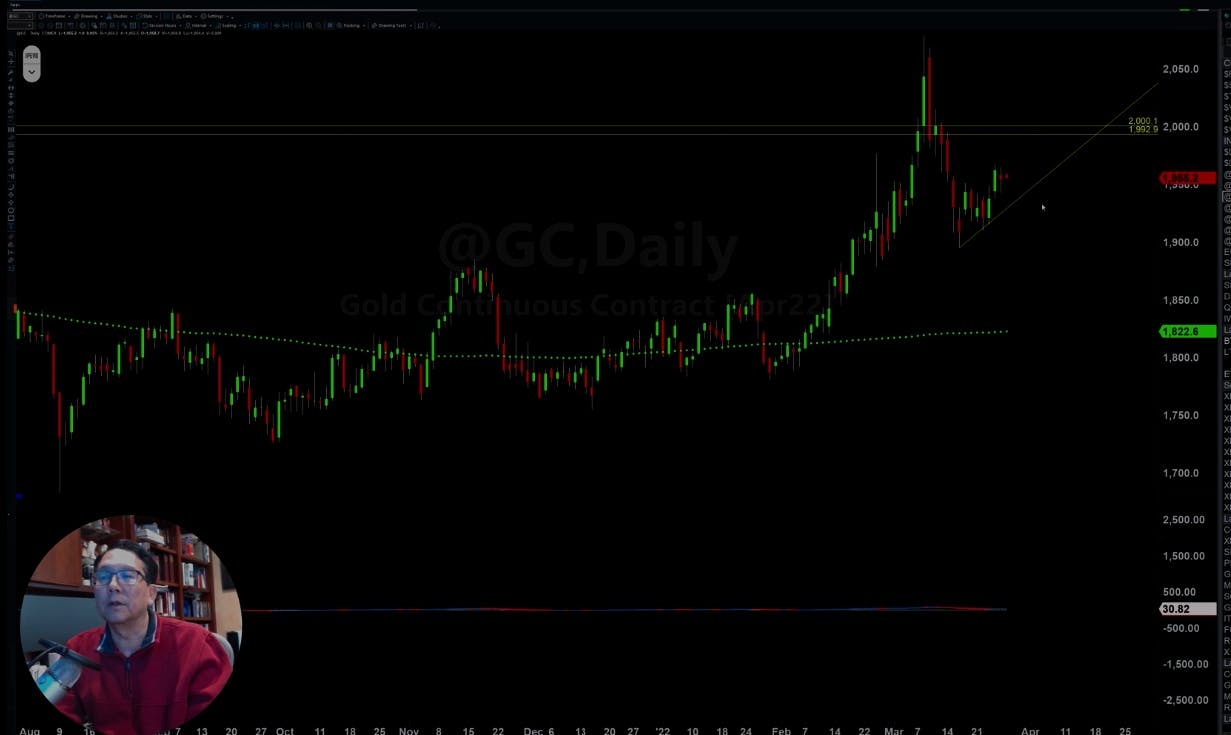
Multiple different factors are coming into play right now for the oil sector and the gold sector.
I explain all the different nuances and subtle market trends I see to my Stock Navigators.
To make sure you’re the very first person to receive my market analysis, please click here.
Stock Navigators
Stock Navigators
Stock Navigators has one mission - to help people improve their lives via trading. And it's all made possibly by our team of stay-at-home day traders who provide the most up-to-date analysis every single day. With over twenty years of combined trading experience, Stock Navigators helps you stay on top of the market.
You may also like


Get started on your path to financial freedom
Get the daily email that makes reading the news actually enjoyable. Stay informed and entertained, for free.

