How To Follow Wall Street Into High-Probability Profits


Technical analysis (TA) shows us many things about the market.
With TA, we can determine low points (Buy Zone) and high points (Sell Zone).
In fact, using TA we can also identify our stop-loss price.
But there’s something else TA can show us… It’s the most important factor when deciding to trade a stock… And that’s what we’re going to talk about today.
You see, all stocks move up and down.
It’s as natural as the ebb and flow of the ocean tide.
Our job as traders is to identify these lows and highs.
However, just because a stock is at a low point does not mean that we should move into it right away.
There’s something else that needs to happen before we can confidently enter a trade.
I’m talking about Wall Street participation.
(A low stock price) + (Wall Street participation) = high probability profits.
If you think about it, this makes sense.
Nobody can make a stock move like the institutions on Wall Street.
The sheer amount of capital they use can cause wild swings in a stock’s price.
In fact, that’s why there’s strict regulation regarding Wall Street selloffs, specifically to prevent a huge, abrupt price swing.
So when we see Wall Street make their move, it’s time for us to follow suit and make the trade.
Which begs the question…
How can you tell when Wall Street moves into a stock?
That’s easy - with technical analysis.
And once you know what to look for… you’ll be able to immediately tell when Wall Street is making their move.
Let’s take a look at a real-life example.
Here’s a chart of the SPY since 2019…
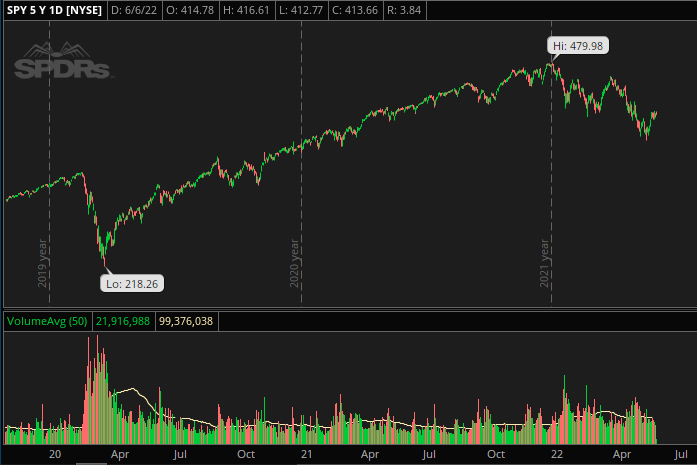
Notice that large spike in volume?
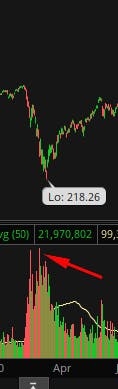
Those big red bars show us that Wall Street was dumping their stock.
This caused the price to move down dramatically.
But the large green bars show us that as soon as Wall Street sold off… they decided to buy back in.
Ever since then, volume has remained relatively steady.
But every now and then we saw a huge, green spike… which tells us institutions were buying… and whenever we saw this spike… the price started moving higher…
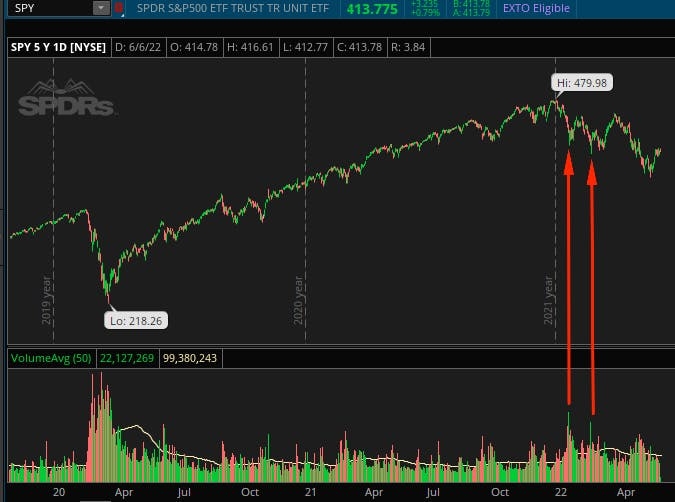
And that’s how you spot Wall Street participation.
Whenever you see an abnormally large spike in volume, it means that financial institutions are making a move.
And we use that to our advantage, move into the trade, and position ourselves for a high-probability profit.
To learn more about Money Zones and tracking Wall Street’s actions, click here.
Stock Navigators
Stock Navigators
Stock Navigators has one mission - to help people improve their lives via trading. And it's all made possibly by our team of stay-at-home day traders who provide the most up-to-date analysis every single day. With over twenty years of combined trading experience, Stock Navigators helps you stay on top of the market.
You may also like


Get started on your path to financial freedom
Get the daily email that makes reading the news actually enjoyable. Stay informed and entertained, for free.

