Oversold & Testing Support: This is What a Short-Term Bounce Looks Like


Political tension has been causing the market to drop rapidly.
Everybody is wondering how low the markets will go.
Right now, the S&P, the Nasdaq, and the Dow are all showing very similar patterns.
The 3 major indices are moving in unison and I have good news.
Currently, all 3 of them are retesting support levels.
If the markets are able to stay above support, we may see stocks rally even higher.
But if it drops below support levels, we may see a lot of red incoming.
Macro Trend Breakdown
One Line Will Determine Which Way Prices Move
If you want to profit from a bullish bounce, there’s only one line you need to pay attention to.
That line is the support level.
If the markets can maintain support, it’s a strong sign that stock prices will move back up.
Of course, we don’t know how far up they will go… but nonetheless we can position ourselves for a quick short-term gain.
Take a look at the S&P…
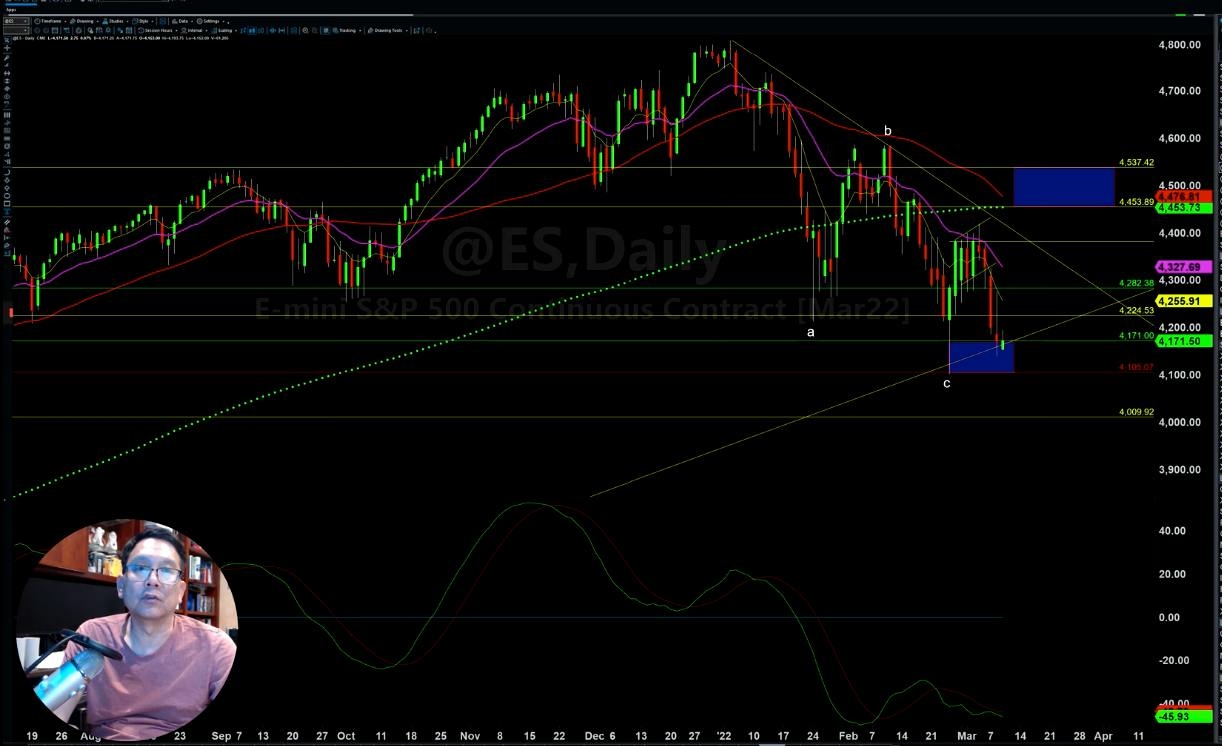
Notice how it’s currently bouncing off the $4,100 level.
This is the support line that I’m talking about.
If the S&P continues to bounce off this line, then we can expect to see movement to the upside follow.
But if the S&P drops below this line, then we may see a very significant pullback.
However, all signs suggest that support will hold.
The Nasdaq and the Dow look identical to the S&P right now.
Which leads me to say if support holds, the overall market will rally higher.
Of course, I’m helping Stock Navigators position themselves for profits no matter which way the market moves - click here for more details.
Sector Highlight
Oversold Sectors vs. Overbought Sectors
Due to the war, many sectors are currently oversold.
The financial sector, the industrial sector, the communications sector, etc… they’re all dropping to support levels and oversold.
For example, here’s the chart of the Financial Select Sector SPDR Fund (XLF).
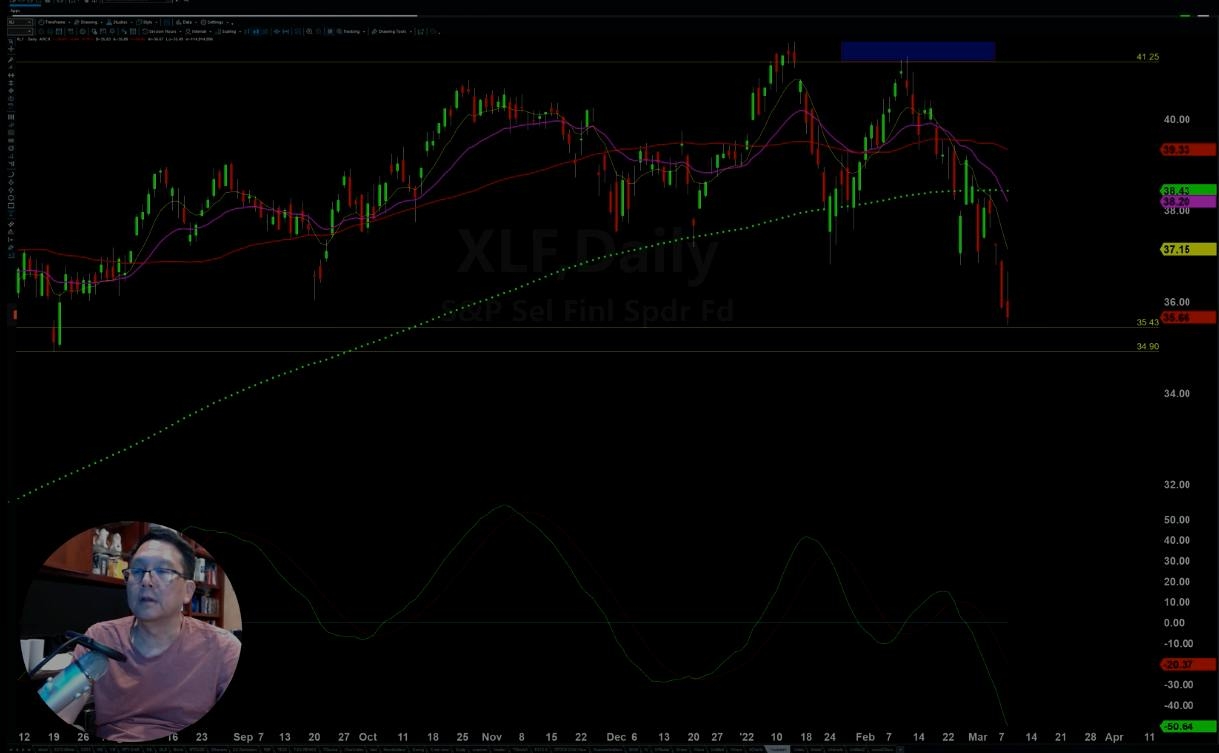
Looks similar to the S&P chart, doesn’t it?
If the financial sector can stay above support levels we’ll probably see a short-term bounce follow.
Meanwhile, the energy sector looks like the complete opposite of the XLF.
Here’s the Energy Select Sector SPDR Fund (XLE).
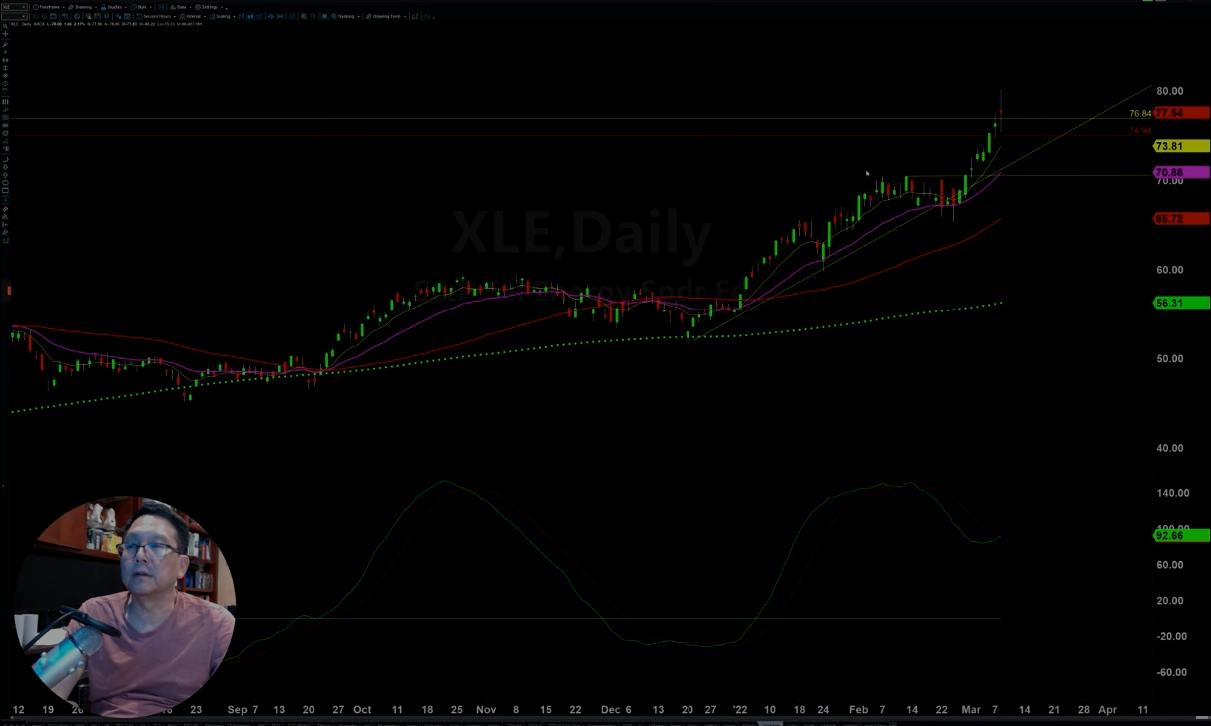
The XLE is currently overbought and trading above resistance levels.
Which means we’ll probably see a very aggressive move to the downside very soon.
I’m analyzing every sector under the sun to show Stock Navigators which industries are strongest right now.
SN Family Secrets
$100,000 in 6 Months - Then He Did It Again in 1 Month!

When Tony heard about Stock Navigators, he didn’t join right away.
In fact, it took him an entire year before he finally decided to join the SN family.
And he is happy he did it!
Tony made $100,000 just 6 months after joining.
That’s what we call big boy money!
But here’s the best part.
He made just shy of $100,000 - again - except this time, he did it in a single month!
Now that’s how you reinvest your profits.
See what he has to say about being a part of the Stock Navigators family…
If you’d like to join the fun and excitement - just click here to see what Stock Navigators can do for you!
Stock Navigators
Stock Navigators
Stock Navigators has one mission - to help people improve their lives via trading. And it's all made possibly by our team of stay-at-home day traders who provide the most up-to-date analysis every single day. With over twenty years of combined trading experience, Stock Navigators helps you stay on top of the market.
You may also like


Get started on your path to financial freedom
Get the daily email that makes reading the news actually enjoyable. Stay informed and entertained, for free.

