How This One Indicator Lowers Risk AND Boost Profits

Everybody says “buy low and sell high” but nobody shows you how to do it.
Here’s a little trick you can use to identify the lows and the highs - use the Money Zone.
The Money Zone is the fundamental trading indicator that I show all new traders.
In fact, it’s the foundation of my own trading strategy.
So let’s go over what the Money Zone is… and how you can use it to make money.
Market Signals
Look for the Blue Box
In technical analysis, we use past performance to determine future movements.
Take Pfizer (PFE), for example.
In the past year, the stock price went up and down at a pretty standard rate.
But if you look closely, you’ll notice that the stock kept hitting a certain low point… before bouncing back up again.
In this case, the stock kept bouncing off of the $45 level.
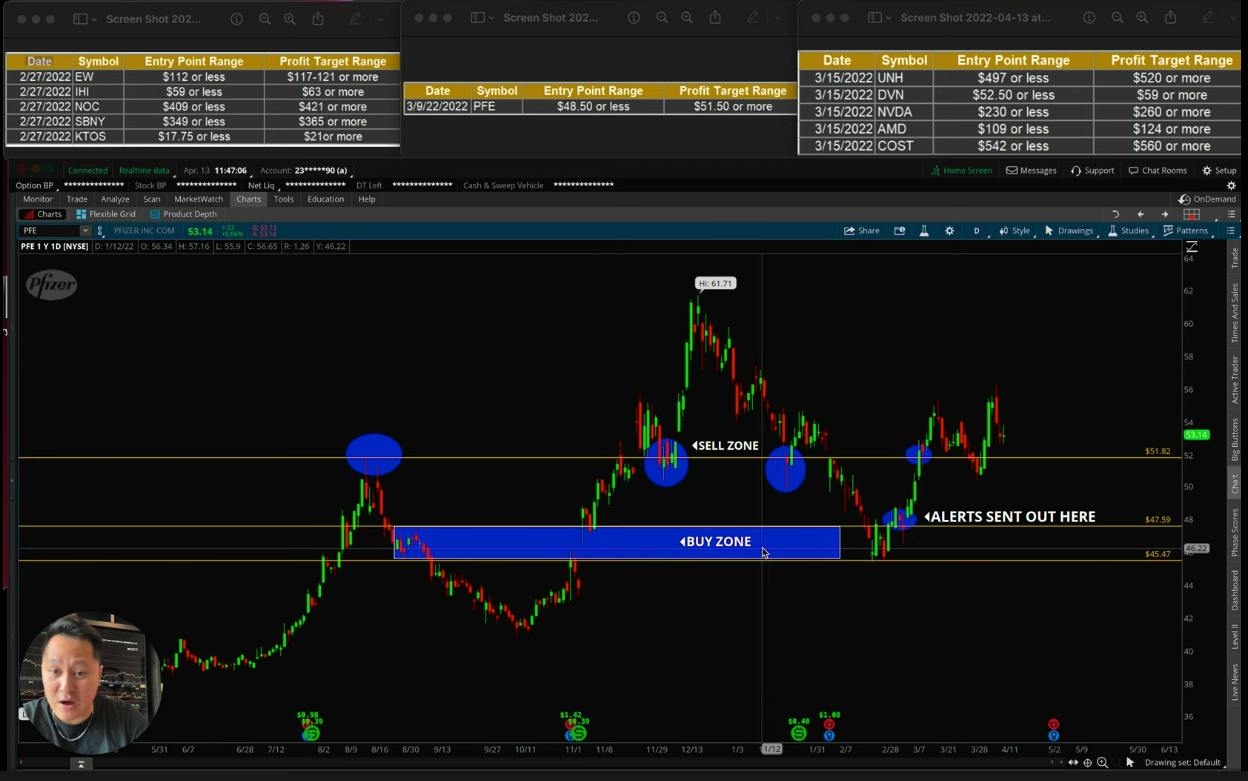
This price point is the Buy Zone.
The Money Zone Method showed us that there was a high probability the stock would bounce off this price, so we positioned ourselves for a predictable profit.
You’ll also notice the Sell Zone in this chart.
Past performance revealed that the stock tends to drop lower after it hits this price point.
So we sell here for an easy gain.
That’s all there is to it!
Whenever I see a Money Zone trade, I send out an email alert and a text alert to my subscribers.
In my email alert, I write down exactly what stock to buy… what price to buy it… and what price to sell it.
If you’d like to start getting my Money Zone trades, click here for more information.
Fast Gains
Predicting 20% Gain in Just 4 Days
Another thing to keep in mind with this strategy is to notice when trends are broken.
Buy & sell zones act like a sort of wall to a stock…
The price bounces up and down between them when they reach each zone.
But these walls can only take so much until they are broken.
Take a look at Northrop Grumman Corporation (NOC).
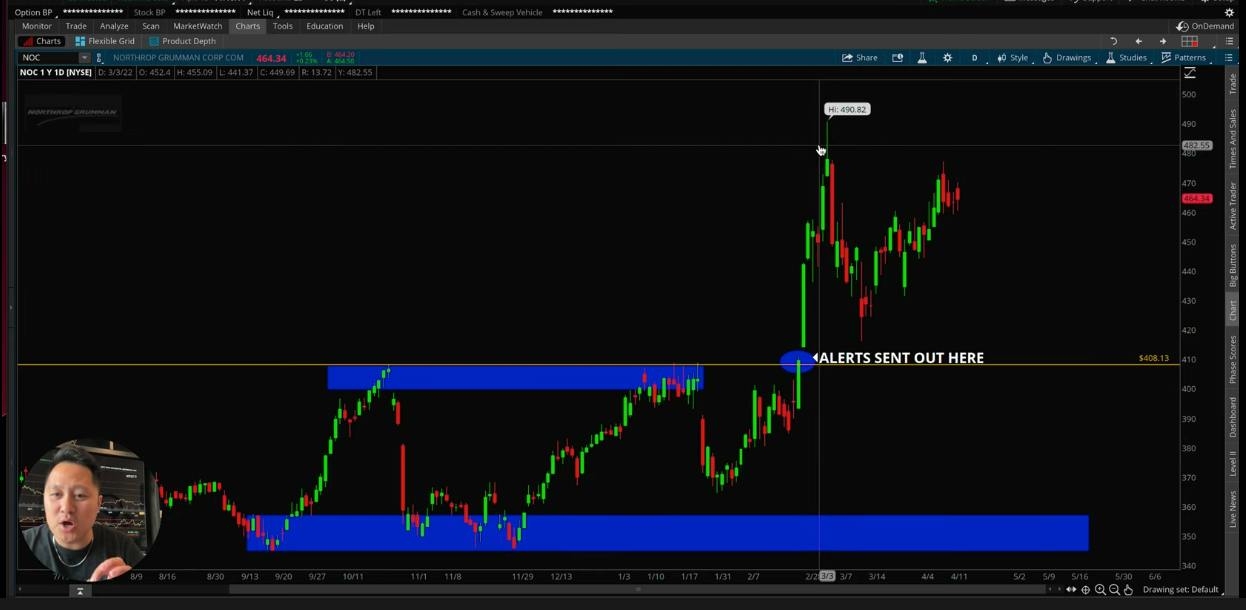
It bounced between the top and bottom zones for about 6 months before Feb. 27 when we saw something change…
As soon as the price went beyond the “wall” of the sell zone, our indicators told us to send an alert saying a big change was coming.
And we were right!
The price went from $409 to $490 in less than 5 days.
If you got in on this trade when the alert went out, you could have stood to make 20% gain on your initial investment in just a week’s time.
You can learn more about these alerts and how you could receive them here.
SN Family Secrets
Helping First-Generation Traders Develop Technical Analysis
I’m always so humbled by the kind words people say about Stock Navigators.
We put a lot of time, money, and resources into creating the ultimate trading-education platform.
We’ve got course videos, live instructor calls, and a student community who are all helping each other achieve their financial goals.
And I’m proud to say the results speak for themselves!
Take a look at how Stock Navigators gave Mario the confidence he needed to trade and invest.
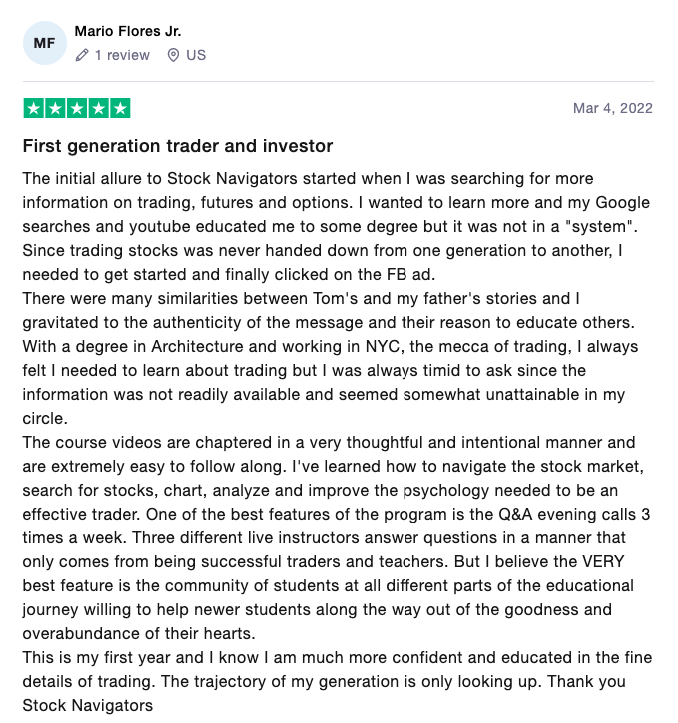
He’s living, breathing proof that you can be a first-generation trader and still be successful in the stock market.
Would you like to join our growing family of like-minded traders?
Click here to see how you can join the Money Zone Trader community!
Stock Navigators
Stock Navigators
Stock Navigators has one mission - to help people improve their lives via trading. And it's all made possibly by our team of stay-at-home day traders who provide the most up-to-date analysis every single day. With over twenty years of combined trading experience, Stock Navigators helps you stay on top of the market.
You may also like


Get started on your path to financial freedom
Get the daily email that makes reading the news actually enjoyable. Stay informed and entertained, for free.

